The frequency domain measurement of RF power is the most basic test of traditional spectrum analyzers and modern vector signal analyzers. Proper testing methods are important to avoid significant errors in the results. The purpose of this application note is to avoid this error by introducing some instrumentation and testing basics.
To achieve proper spectrum measurements, a number of frequency and amplitude controls must be used when configuring the spectrum analyzer (see Figure 1).
Amplitude controlFigure 1 depicts the key amplitude controls and how they affect the test results.
Ref Level: The reference level sets the maximum input range of the spectrum analyzer. The reference level controls the y-axis parameters of the instrument, similar to the V/Div (voltage grid) on the oscilloscope. The reference level should be set to be slightly higher than the estimated maximum power level present in the test. The optimal reference level is at the balance between instrument distortion and minimum instrument background noise. In some cases, it is also beneficial to deliberately set a lower reference level (which would cause some instrument distortion) for wideband noise testing. The benefit of this is that it can improve test sensitivity by recognizing that the test results are somewhat distorted and that distortion is not one of the test metrics.
The input range of the instrument can also be set via the attenuator setting control. Normally this control is set to Auto so the software can adjust the amount of attenuation based on the reference level setting. Conventional instruments, such as spectrum analyzers, link the y-axis of the display to the reference level or the attenuator in the firmware, but the virtual instrument is not limited by this - the y-axis can be removed from these controls if needed. This feature is sometimes useful, such as when you want to amplify a portion of interest on the spectrum without affecting the amplitude settings of the instrument.
Detection mode is another type of amplitude control that is only applicable to traditional swept spectrum analyzers, not FFT-based analyzers. Understanding frequency control is very important before we discuss the detection mode.
Frequency controlFigure 1 also describes the key frequency controls and how they affect the test results.
Center frequency: The center frequency is the center frequency that controls the measurement. The center frequency, along with the test bandwidth, defines the range of frequencies seen on the instrument panel.
Test Bandwidth: The test bandwidth defines the total amount of spectrum captured by the instrument. The test bandwidth is centered around the center frequency.
Resolution Bandwidth (RBW): Resolve the bandwidth to control the frequency resolution of the frequency axis. In a conventional spectrum analyzer, a narrowband filter is used to scan across the test bandwidth to produce a spectral display. The filter bandwidth determines the frequency resolution on the frequency axis. However, there is no analog filter in an FFT-based analyzer. Instead, the frequency resolution or resolution bandwidth is determined by the FFT and its corresponding filtering window parameters. However, in such instruments, the more appropriate name should be frequency resolution.
Those familiar with FFT analyzers and FFTs may ask: What is the relationship between the RBW frequency resolution parameter and the size of the FFT window? Table 1 below shows the bin size (?F = sample rate / number of samples) and the relationship between -3dB and -6dB resolution bandwidth.
Note that FFT-based spectrum analyzers, such as the PXI-5660RF signal analyzer, provide a window selection to limit spectral leakage and improve resolution between signals with small spacing in the frequency domain. Traditional spectrum analyzers do not provide this functionality.
In conventional scanning analyzers, the test time (scan time) is inversely proportional to the square of the RBW due to the influence of the setup time of the analog filter. At this time, as the frequency resolution is improved as the RBW is reduced, the scan time increases exponentially. For FFT signal analyzers, when reducing RBW, it is corresponding to performing longer acquisitions and larger FFT calculations. As DSP devices become faster and faster, this means that for higher resolution (narrower RBW) measurement devices, FFT-based testing will have significant advantages in terms of test speed.
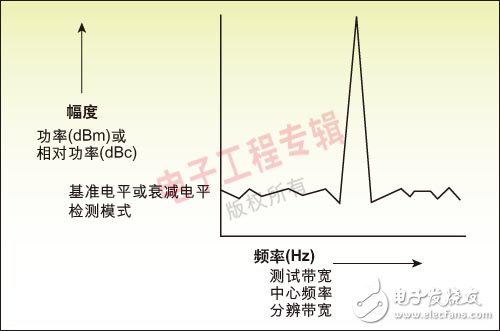
Figure 1. Basic spectrum display and related controls
Detection mode and impact on power measurementThe detection mode (standard, peak, sample or valley) determines how the spectrum analyzer processes the reduced or compressed spectrum information. When the spectral data points exceed the display capabilities of the spectrum analyzer, the spectrum analyzer must reduce the data. In this way, the detection mode can greatly change any power measurement.
Table 1 summarizes the different detection modes and their impact on integrated power testing.
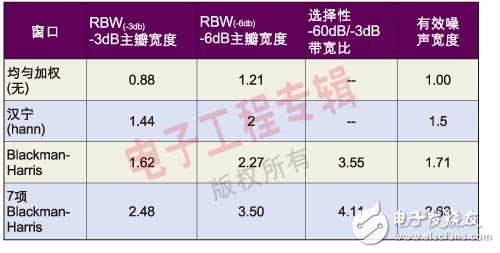
Table 1. Relationship between filter window size and RBW
Factors affecting frequency accuracy in RF instrumentsConventional spectrum analyzers use a frequency sweep method between the start frequency and the stop frequency. This sweep method relies on an analog ramp signal, and the starting frequency is synthesized directly from the high-precision time base reference. Therefore, the accuracy of the analog ramp signal and the accuracy of the center frequency of the IF filter will constrain the accuracy of the starting frequency. The FFT-based analyzer is not constrained by this limiting factor because analog ramp signal scanning filters are not required. The accuracy of the frequency test is consistent over a given test bandwidth. The accuracy within the test bandwidth depends only on the time base accuracy and measurement algorithm, so it is easy to obtain better frequency accuracy and repeatability.
In traditional swept spectrum analyzers, the main factors causing frequency errors are:
* Reference frequency error
* Test bandwidth error (usually 0.5% of bandwidth)
* Resolve bandwidth error (usually 15% of RBW)
In contrast, in FFT-based analyzers, the main factors that cause frequency errors are:
* Reference frequency error
* Resolve bandwidth error (from less than 10% of RBW to more than 50% of RBW, depending on the measurement algorithm used)
To compare the errors of these two types of devices, it is appropriate to ignore the reference frequency error because the error can be compensated for by using a high-precision frequency reference, such as a é“· reference source. Test bandwidths above 50 kHz and RBW settings greater than 1 kHz affect the measurement performance of conventional swept spectrum analyzers unless an optimized method is used, such as adding a 100 MHz signal at the center of the test bandwidth. Due to the scan time of the filter, if a smaller RBW is required, it is equivalent to a longer measurement time. For a given example, the conventional spectrum analyzer employs a scan time of 150ms to 200ms.
The accuracy of an FFT-based analyzer will be primarily limited by the test algorithm. The algorithm used in the Spectrum Test Toolkit, the test software used in the NI PXI-5660 RF Signal Analyzer, uses a patent-pending 3-point interpolation method that achieves higher resolution than indicated by the resolution bandwidth. In the above example, setting the RBW to 2 kHz is not a problem for achieving higher accuracy than required.
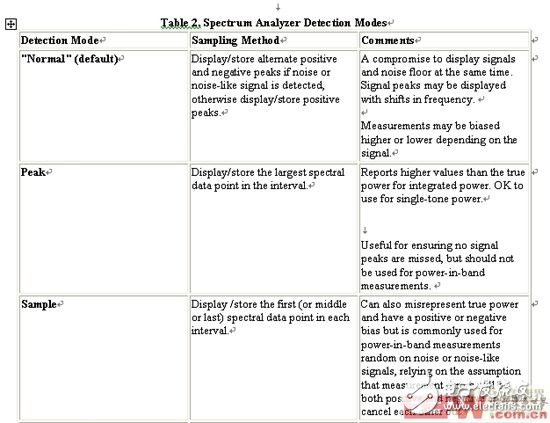
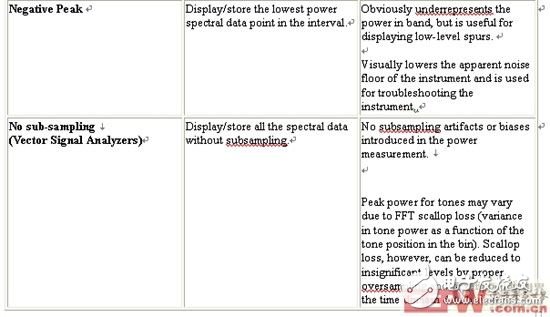
Table 2: Spectrum Analyzer Detection Mode
An FFT-based analyzer can use a relatively large RBW setting to accurately measure frequency without the need for precision-optimized testing techniques, which is equivalent to enabling faster or more accurate measurements during the same test time. The NI PXI-5660 RF Signal Analyzer can complete the above test examples in less than 20ms, which is more than 6 times faster than traditional spectrum analyzers.
Summary of this articleIt seems that understanding and mastering the above basic knowledge is necessary when using traditional spectrum analyzers and FFT-based signal analyzers for power and frequency testing. The correct instrument settings must be used, otherwise the test results may vary greatly and even if the same instrument is used. Therefore, for each specific test, understanding how the instrument works is critical to properly selecting the instrument's settings to perform the specified measurements.
A27 3000 Puffs,Replaceable Atomizer Vape Atomizer,A27 3000 Puffs Healthy,A27 3000 Puffs Made
Lensen Electronics Co., Ltd , https://www.lensenvape.com