The system software user interface can complete the input and setting of all measurement parameters and respond to user operations in a timely manner. In addition to this thread, an additional worker thread is created to realize parallel work of other functions, improve system real-time performance, and update the display instrument operation in real time on the user interface. The status and system measurement progress is for the user to understand the system status, and the measurement data is read and saved in real time for further processing and research.
0 Preface
With the application and popularization of computer technology and modern electronic measurement technology in the field of instruments, especially the computer interface of electronic measuring instruments and the emergence of corresponding standards, the communication between the computer and the instrument is simple and easy, and the user can control the instrument through the computer program. Data reading and storage, the development of these technologies makes the realization of the antenna automatic measurement system possible.
In the past, a single-thread-based simple measurement system, the response to user operations and the switching between multi-tasks required to use "interrupt processing" to complete, greatly affecting the real-time and work efficiency of the system, the software enters the data reading during the measurement process. The cyclic process with the storage causes the user interface to enter a "fake death" state, unable to control the measurement and understand the real-time progress of the system measurement. In order to make up for these shortcomings, multi-tasking parallel work is required, and multi-threading technology avoids blocking, performs multiple tasks at the same time, reduces the interaction between the running process and the user interface, and maximizes the performance of multi-processor. The unique advantages well meet this requirement.
This paper designs a set of antenna real-time measurement system based on multi-thread technology, which provides a user interface with simple layout and complete functions. It can complete the input and setting of all measurement parameters and respond to user operations in a timely manner. Work, improve the real-time performance of the system, update the operating state of the display instrument and the measurement progress of the system in real time on the user interface for the user to understand the system status, and realize the real-time reading and storage of the measurement data, which is convenient for further processing and research in the later stage.
1 System Overview
1.1 How the system works
The measurement system uses a rotating antenna measurement method, and the auxiliary antenna (source antenna) is connected to the transmission port of the vector network, and the antenna to be tested is connected to the receiving port of the vector network, so that the plane to be tested of the antenna to be tested is parallel to the rotation plane of the turret, and the measurement is performed using the vector network. Transmission parameters (S-parameters) at different angles, with which data can be used to make antenna patterns at specific frequencies. In addition, the frequency sweeping characteristic of the vector network provides another advantage for antenna measurement. In one measurement, measurement data of multiple frequency points in a certain frequency band can be obtained, and data of different frequency points and antenna pattern can be compared. The frequency characteristics of the antenna are compared and analyzed.
1.2 System components
The test system consists of five parts: microwave darkroom, computer (system software), vector network analyzer, program-controlled turntable and source antenna. Its layout is shown in Figure 1.
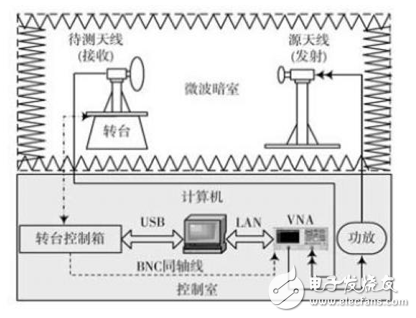
Figure 1 System composition
The main control computer and the vector network analyzer are interconnected through the LAN line. Compared with the traditional GPIB bus mode, the communication distance limit is exceeded, and the data flow is large, the control is flexible, the device is easy to share, and the data is shared. The vector network analyzer is used for transmitting and receiving the frequency sweep signal. The source antenna is connected to the power amplifier connected to the power transmitting end of the vector network analyzer through the coaxial line, and the power antenna of the antenna to be tested passes through the coaxial line and the power receiving port of the vector network analyzer. Connected.
The main control computer and the turntable control box are connected through the USB interface. It is not necessary to consider the mechanical flow of the turntable control. It only needs to program the communication with the control box to control the turntable and obtain the turntable status data. The vector network analyzer and the turntable control box are connected by a BNC connector coaxial cable, and the turntable control box sends a trigger pulse required for measurement to the vector network analyzer through the cable.
2 system software implementation
The compilation environment used to write the system software is based on VC++ MFC (Microsoft FoundaTIon Classes), using Object Oriented Programming (OOP) method, respectively using SCPI (Standard based on VISA (Virtual Instrument Software Architec-ture) library) The Commands for ProgrammableInstruments command and the Mint motion control language are programmed to communicate with the computer and vector network analyzers and turntables, to control the instrument and to read information and data.
2.1 Software layered structure and information interaction
The system software is the control core of the whole system. Its function is transparent to the user. For the user, as long as the correct measurement parameters are selected and input, the system can automatically complete the corresponding measurement function.
According to the software requirements and functions, it can be divided into three layers:
User interface part, data processing part and hardware interface part.
The information interaction between the layers of the system software is shown in Figure 2.
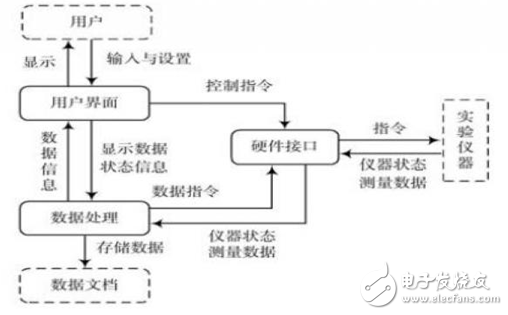
Figure 2 Information interaction between layers of software
The user interface part transmits the hardware setting to the hardware interface part in response to the user operation, sends the input data to the data processing part, and simultaneously displays the data and status information sent by the data processing part to the user, so that the user can conveniently complete the measurement control. With monitoring. The data processing part, on the one hand, processes the data and status information transmitted by the hardware interface, converts it into a format required by the user for display and storage; on the other hand, converts the data information set by the user into a data command and gives it to the hardware interface part.
The hardware interface part completes the communication between the computer and the instrument. On the one hand, the programming language such as instructions and data is converted into the machine language recognized by the instrument to the instrument; on the other hand, the data and status information transmitted by the instrument are converted into Program the processed data for use in the data processing section.
2.2 Software task analysis
According to the working principle of the system, the system software needs to complete the following tasks:
(1) Establish communication between the computer and the turntable control box: establish a channel so that the computer can read the real-time running status of the turntable, and can control the turntable at any time to change its running state.
(2) Display of the running state of the turntable: Display the speed and angle information of the turntable to the user interface and update it in real time.
(3) Setting of the running parameters of the turntable: set the moving speed, starting and stopping position and pulse output mode of the turntable according to the user input, and control the start and stop of the movement.
(4) Establish communication between the computer and the vector network analyzer: establish a channel so that the computer can read the state of the vector network and measure the data, and can control the vector network at any time to change its operating state.
(5) Initialization of vector network analyzer and setting of measurement parameters: Using the SCPI instruction based on the VISA library, the vector network is initialized to enter the measurement state, and the measurement parameters are set according to the user input.
(6) Establishment and update of the measurement data storage document: The document is created in the computer for the storage of the measurement data, and the measurement process is recorded in real time from the measurement data read by the vector network in a specific format.
(7) Display of system measurement progress: output the corresponding prompt text to the user interface during the software running node in the measurement process, when a certain measurement is completed during the measurement process, and after the measurement is completed.
In real-time measurement systems, computers are required to perform multiple tasks at the same time, and have high real-time requirements. Multi-threading technology avoids blocking, can perform multiple tasks at the same time, and reduces the interaction between the running process and the user interface. And the unique advantages of maximizing the performance of multiprocessors are well suited to this requirement.
2.3 Software multi-threaded implementation
There are two types of threads in MFC, user interface threads and worker threads. The former has its own message queue and message loop, which is generally used to process user input independent of other thread execution, responding to events and messages generated by the user and the system; the latter has no message loop, and is usually used to perform background calculations and Maintenance tasks, such as lengthy calculations, cyclic reading of data, etc.
Any MFC program has at least one thread and is the main thread of the program. Any thread can be generated or terminated by the main thread, and the main thread is always present until the program terminates. The user interface thread is the main thread that is started by the program by default, and mainly implements software operation and responds to user operations and control. According to the software task analysis part, three worker threads are generated in the main thread, and the communication between the computer and the measuring instrument is completed, and the setting of the instrument parameters and the real-time data collection and processing of the data are completed.
The working order and survival time of each thread are shown in Figure 3.
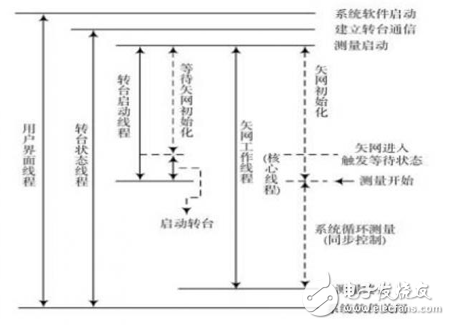
Figure 3 Working order and lifetime of each thread
The specific work done by the three worker threads is as follows:
Turntable state thread: establish communication between the computer and the turntable control box, continuously read the position information and speed information of the turntable and update it to the user interface, corresponding to the task (1) and (2) of the software task analysis part, the flow is as shown 4 is shown.
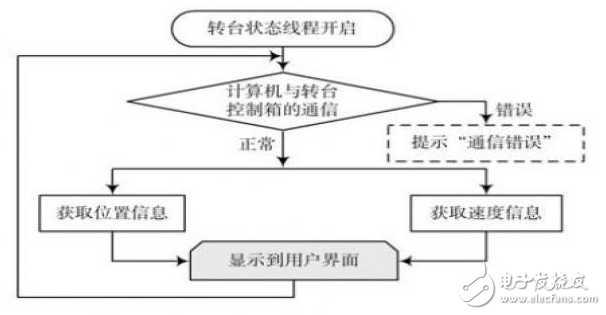
Figure 4 turntable state thread
The turntable starts the thread: first enters the waiting state. After the initialization of the vector network and the establishment of the data file, the command is sent to the turntable control box to set the running parameters of the turntable to start the motion, corresponding to the task of the software task analysis part (3), the flow is as shown in the figure 5 is shown.
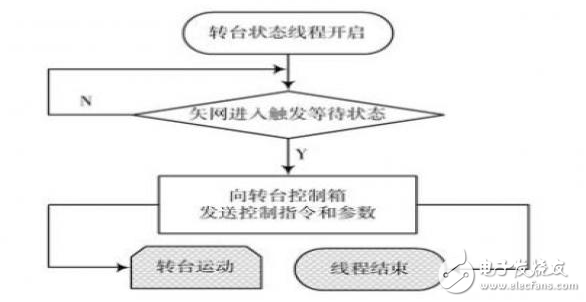
Figure 5 turntable startup thread flow chart
The vector network worker thread: its function is to send instructions to the vector network for initial setting, so that the vector network enters the trigger waiting state, and establishes a data storage document. During the measurement process, the measurement state of the vector network is continuously read, and each time a measurement is completed, The measurement data is read and saved into the document, and the measurement progress is displayed to the user interface, corresponding to the task (4)~(7) of the software task analysis part, and the process is as shown in FIG. 6.
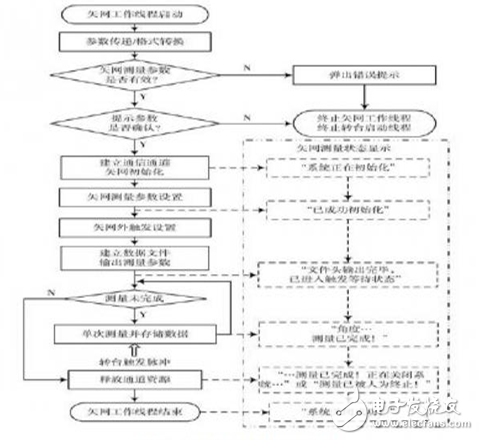
Figure 6 Flow chart of lost network work thread
3 system performance
3.1 System Software User Interface
The system software user interface divides and layouts according to functions to ensure clear view and convenient operation. As shown in Figure 7, the area marked by the serial number is as follows:
(1) System menu: You can complete some general system settings, such as instrument switching, data output format and instrument operation mode selection. These settings do not need to be changed frequently, and the default settings are available for general testing.
(2) Common settings: used to input the measurement parameters of the vector network and the running parameters of the turntable, as well as the selection of the file output position and the input of the custom file name. This section is a setting that often needs to be changed when the system is running, and it interacts frequently with users.
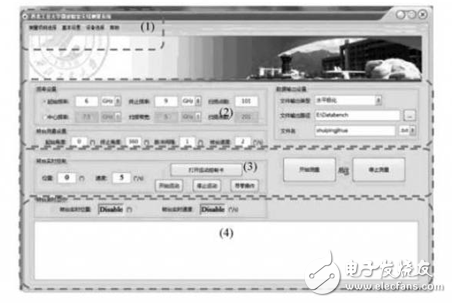
Figure 7 User Interface Main Dialog
(3) Measurement control: control the start and stop of the measurement, and also control the operation of the turntable in the non-measurement state. The user can control the operation of the system and adjust the position of the turntable.
(4) System operation status display: Real-time display of the rotation speed and current position of the turntable, and continuously update the display system's running progress during the measurement process. With this information, the user can know the status of the system in order to make appropriate actions.
3.2 Measurement examples Select the BJ-32 standard rectangular pyramid horn antenna in the laboratory, and measure it separately using Agilent and Anritsu vector network analyzer. The relevant parameters are shown in Table 1. Select the data of the 3.26 GHz frequency point in the data obtained from the two measurements. The antenna normalization pattern is shown in Figures 8 and 9.
Table 1 measured parameters 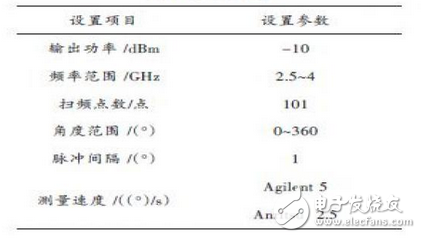
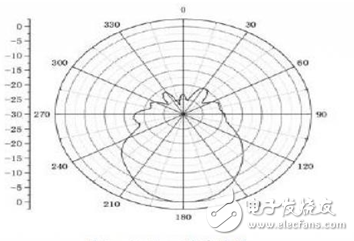
Figure 8 Agilent measurement results 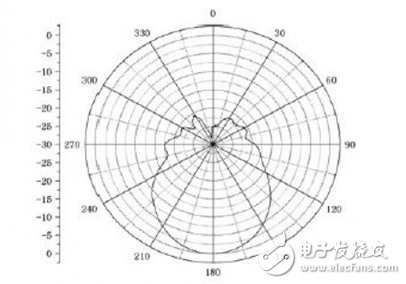
Figure 9 Anritsu measurement results
4 Conclusion
The system takes the computer as the core and makes full use of the computer communication interface of the advanced instrument of the laboratory. The user interface of the system software has clear layout and comprehensive functions, which reduces the direct operation of the instrument and protects the valuable instrument and reduces the maintenance cost. . The use of a vector network analyzer in the system allows the system to have the ability to acquire multi-frequency antenna data with a one-time scan measurement. The use of common standard instructions in programming enhances the portability and scalability of the software. The use of multi-threading technology realizes the parallel work of multi-tasking, meets the real-time requirements of the system, enables the user to intuitively understand the running state of the system and the measurement progress through the user interface, and can also read and save the antenna measurement data in real time. For further processing and research.
Communication Industrial Control Monitoring And Automation Connecting Line
Communication industrial control monitoring and automation connecting line:RJ11,RJ45,RF,M8,M12,Wire to Wire,DC JACK,Phone Jack,DISPLAYPORT CABLE,DIN
Industrial control harness: 1, according to customer requirements to provide different types of connector and enclosure suitable wire
2. Line color according to customer requirements
3. The joint meets the requirements of ipc-620
4. Assembling and testing equipment ensures correct wiring diagram and high efficiency of production line
5. 100% path short circuit test
6. 100% high voltage test
Industrial equipment harness
1: Application Industry: widely used in, instrumentation, automobile, machinery, electric vehicle, machine tool equipment, medical equipment, electronics, industrial automation, signal transmission, power control, and other high-tech electrical products.
2: It can be customized.
3: Product advantages: small batch can be done, processing equipment is perfect, testing equipment is perfect.
Communication industrial control monitoring and automation connecting line
ShenZhen Antenk Electronics Co,Ltd , https://www.antenksocket.com