The Suzhou Industrial Park Jiuling Apartment Project is located in the Suzhou Industrial Park. In the southeast of the Jiuling Apartment plot, a nursing home building will be built, covering an area of ​​about 1428.08 m2 and a building area of ​​about 11199.18 m2. The nursing home is a single social medical institution open to the outside world, with a total of 112 rehabilitation wards.
This project is a power monitoring system for the Jiuling Apartment Project in Suzhou Industrial Park. According to the requirements of power distribution system management, it is necessary to perform power management on the low-voltage distribution inlet and outlet circuits in the substation of the Suzhou Industrial Park Jiuling Apartment Project to ensure the safe, reliable and efficient use of electricity.
The Acrel-2000 low-voltage intelligent power distribution system makes full use of the latest development of modern electronic technology, computer technology, network technology and fieldbus technology to carry out decentralized data collection and centralized monitoring and management of the power distribution system. Network the secondary equipment of the power distribution system, and connect the field equipment of the scattered power distribution station into an organic whole through the computer and communication network, so as to realize the remote monitoring and centralized management of the operation of the power grid.
1 System structure descriptionThis monitoring system mainly realizes the power consumption monitoring and power management of the power distribution system of the Jiuling Apartment Project in Suzhou Industrial Park. The monitoring range is 162 ACR210EL/K self-produced by Ankerui in a substation, which is divided into 7 buses and pulled directly to the duty. The room collector is then connected to the monitoring host in the duty room through protocol conversion, so as to realize the data connection between the instrument on the bus and the monitoring host.
This monitoring system adopts a hierarchical and distributed structure, that is, the station control layer, the communication layer and the bay layer;
As shown in Figure 1:
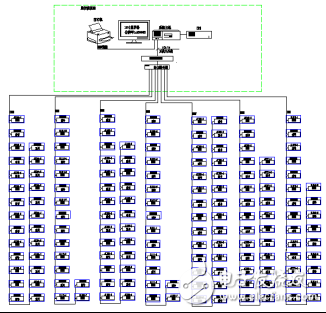
Figure (1) Network topology diagram
Interval equipment layer is mainly: multi-function network power meter. These devices are installed in the electrical cabinet corresponding to the corresponding primary equipment. These devices all adopt RS485 communication interface and communicate through the field MODBUS bus network to realize data collection on the spot.
The network communication layer is mainly: the communication server, its main function is to collect the collection devices scattered in the field, and at the same time transmit it to the station control layer remotely, to complete the data interaction between the field layer and the station control layer.
Station control management: equipped with high-performance industrial computers, monitors, UPS power supplies, printers and other equipment. The monitoring system is installed on the computer, collects and displays the operating status of the field equipment in a centralized manner, and displays it to the user in the form of human-computer interaction.
The above network instruments all use RS485 interface and MODBUS-
RTU communication protocol, RS485 uses shielded wire transmission, generally two wires are used, and the wiring is simple and convenient; the communication interface is half-duplex communication, that is, both parties of the communication can receive and send data but can only send or receive data at the same time. The highest data transfer rate is 10Mbps.
The RS485 interface is a combination of balanced drivers and differential receivers, with enhanced anti-noise interference capability. Up to 32 devices are allowed to be connected on the bus, and the maximum transmission distance is 1.2km.
2 Main functions of power monitoring system2.1 Data collection and processing
Data collection is the basis of power distribution monitoring. The data collection is mainly completed by the bottom multi-functional network instrument collection to realize the local real-time display of remote data. The signals that need to be collected include: three-phase voltage U, three-phase current I, frequency Hz, power P, power factor COSφ, electricity Epi, remote device operating status and other data.
Data processing is mainly to display the electrical parameters collected as required to the user in real time and accurately, to achieve the automation and intelligent requirements of power distribution monitoring, and to store the collected data in the database for user inquiries.
2.2 Human-computer interaction
The system provides a simple, easy-to-use, and good user interface. Adopting a full Chinese interface, CAD graphics display the primary electrical wiring diagram of the low-voltage power distribution system, display the status of the power distribution system and the corresponding real-time operating parameters, the screen regularly patrols switching; the screen is dynamically refreshed in real time; analog display; switch display; continuous Record display etc.
2.3 Historical events
The historical event viewing interface mainly provides convenient and friendly human-computer interaction for users to view past fault records, signal records, operation records, and over-limit records. Through the historical event viewing platform, you can easily locate you according to your own requirements and query conditions The historical events to be viewed provide good software support for you to grasp the operation of the entire system.
2.4 Database establishment and query
It mainly completes the timing collection of remote measurement and remote information, and establishes a database, and generates reports on a regular basis for users to query and print.
2.5 User authority management
For users of different levels, different authority groups are set to prevent the loss of production and life due to human misoperation, and realize the safe and reliable operation of the power distribution system. Users can log in, log out, modify passwords, add and delete operations through user management, which is convenient for users to modify accounts and permissions.
2.6 Operating load curve
The load trend curve function is mainly responsible for regularly collecting incoming line and important loop current and power load parameters, and automatically generating a running load trend curve, which is convenient for users to know the operating load status of the equipment in time. Click the corresponding button or menu item on the screen to complete the switch of the corresponding function; you can view the real-time trend curve or historical trend line; you can perform operations such as translation, zoom, and range conversion on the selected curve to help users enter the line trend
Potential analysis and fault recall provide intuitive and convenient software support for analyzing the operating status of the entire system.
2.7 Remote report query
The main function of the report management program is to design report styles according to the needs of users, filter, combine and count the data processed in the system to generate the report data that users need. This program can also adopt regular saving, printing or summon saving and printing modes for report files according to the needs of users. At the same time, this program also provides users with the function of managing the generated report files.
The report has the functions of freely setting the query time to realize the energy statistics of the day, month and year, data export and report printing.
3 case analysisThe power monitoring system of the Jiuling Apartment Project in Suzhou Industrial Park is divided into a substation. This project performs power management for the 0.4kV power distribution system of this substation. According to the monitoring of the substation, it completes the operation and management of the substation, as well as Full control of the energy consumption of the entire building.
The main energy-consuming circuit of the power distribution station adopts multi-function meters. Our company also has corresponding model meters, ACR series multi-function meters, which are network power meters designed for the power monitoring needs of power systems, industrial and mining enterprises, public facilities, and smart buildings. It can measure all conventional power parameters, such as: three-phase voltage, current, active power, reactive power, power factor, frequency, active power, reactive power and other electrical parameters. And this instrument has 2 photoelectric isolation switch input contacts, these contacts can cooperate with the intelligent circuit breaker to realize the remote signal operation of the circuit breaker. This series of network power meters are mainly used in substation automation, distribution network automation, residential power monitoring, industrial automation, energy management systems and intelligent buildings.
The secondary diagram of low-voltage power distribution is shown in Figure (2). The function is to monitor the electrical parameters of the operating equipment, including: line three-phase voltage, current, power, power factor, electrical energy, frequency and other electrical parameters and the distribution loop Three-phase current; the remote signal function realizes the display of the operating status of the field equipment, including: the opening and closing operating status of the switch and the communication fault alarm; when the circuit breaker is displaced, an alarm signal will be issued to remind the user to deal with the fault in time.
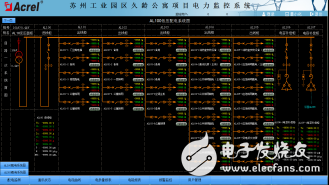
Figure (2) Secondary diagram of low-voltage power distribution
The remote signaling and remote measurement alarm functions mainly complete the monitoring of the switch operation status of the low-voltage outlet circuits and the load incoming line. The pop-up alarm interface for switch displacement and load limit violations indicates the specific alarm location and sounds the alarm to remind the duty personnel to deal with it in time. The load limit can be set freely under the corresponding authority. With historical query function. See figure (3).
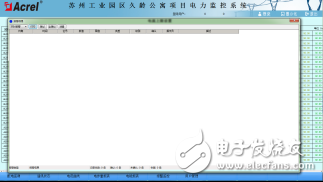
Figure (3) Real-time telesignal alarm and historical telemetering alarm information query
Parameter meter reading function, mainly to query the electrical parameters of the low-voltage outgoing circuit. Supports electrical parameter query at any time, with functions such as data export and report printing. This report queries the electrical parameters of each low-voltage circuit of the 4 transformer outlets in the substation, mainly including: three-phase current, active power and active power, and transformer temperature. The name of each circuit in this report is associated with the database, which is convenient for users to modify the name of the circuit. See figure (4).
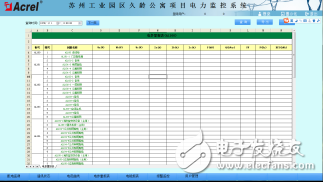
Figure (4) Parameter meter reading
The power consumption report function can select the time period for query, supports the cumulative query of the power consumption at any time period, and has the functions of data export and report printing. Provides accurate and reliable electric energy reports for the personnel on duty. The name of each circuit in this report is associated with the database, which is convenient for users to modify the name of the circuit. As shown in the figure below, the user can directly print the report for the accurate power consumption of each distribution circuit in the substation, and save it to other locations in EXCEL format. See figure (5).
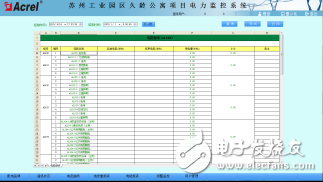
Figure (5) Electric energy report
A schematic diagram of the system communication structure, which mainly shows the network structure of the system. The system adopts a hierarchical distributed structure and monitors the communication status of the bay layer equipment at the same time. Red means communication is normal, and green means communication is faulty. See figure (6).
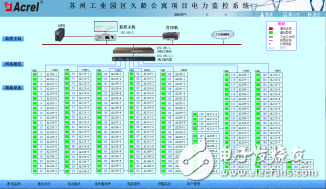
Figure (6) Schematic diagram of system communication structure
4 ConclusionWith the development of society and the widespread application of electricity, the power monitoring system has become an inevitable choice for users of large-area multi-substations such as key projects, landmark buildings/large public facilities, etc., the Acrel-2000 power monitoring system introduced in this article The application of the Jiuling Apartment Project in Suzhou Industrial Park can realize real-time monitoring and power management of the power consumption of the high and low voltage distribution circuit of the substation. It can not only display the power consumption status of the circuit, but also has the network communication function, which can communicate with the serial server, Computers, etc. form the power monitoring system. The system realizes the analysis and processing of the collected data, displays the operating status of the distribution circuits in the substation in real time, has a pop-up alarm dialog box and voice prompts for opening and closing, load limit violations, and generates various electric energy reports, analysis curves, Graphics, etc., are convenient for remote meter reading, analysis and research of electric energy. The system is safe, reliable and stable in operation, providing a true and reliable basis for users of substations to solve power problems, and has achieved good social benefits.
ZGAR AZ Vape Pods 5.0
ZGAR electronic cigarette uses high-tech R&D, food grade disposable pod device and high-quality raw material. All package designs are Original IP. Our designer team is from Hong Kong. We have very high requirements for product quality, flavors taste and packaging design. The E-liquid is imported, materials are food grade, and assembly plant is medical-grade dust-free workshops.
From production to packaging, the whole system of tracking, efficient and orderly process, achieving daily efficient output. WEIKA pays attention to the details of each process control. The first class dust-free production workshop has passed the GMP food and drug production standard certification, ensuring quality and safety. We choose the products with a traceability system, which can not only effectively track and trace all kinds of data, but also ensure good product quality.
We offer best price, high quality Pods, Pods Touch Screen, Empty Pod System, Pod Vape, Disposable Pod device, E-cigar, Vape Pods to all over the world.
Much Better Vaping Experience!

ZGAR AZ Vape 5.0 Pods,ZGAR AZ Vape Pods 5.0,ZGAR AZ Vape Pods 5.0 Pod System Vape,ZGAR AZ Vape Pods 5.0 Disposable Pod Vape Systems
ZGAR INTERNATIONAL(HK)CO., LIMITED , https://www.zgarvapor.com